In real life situations the market inst going to follow the ideal exponential graph. Yes because no one can predict the outcome of data.
|
1. exponential 2. Domain is All Real Numbers 3. Range is x is greater than 0 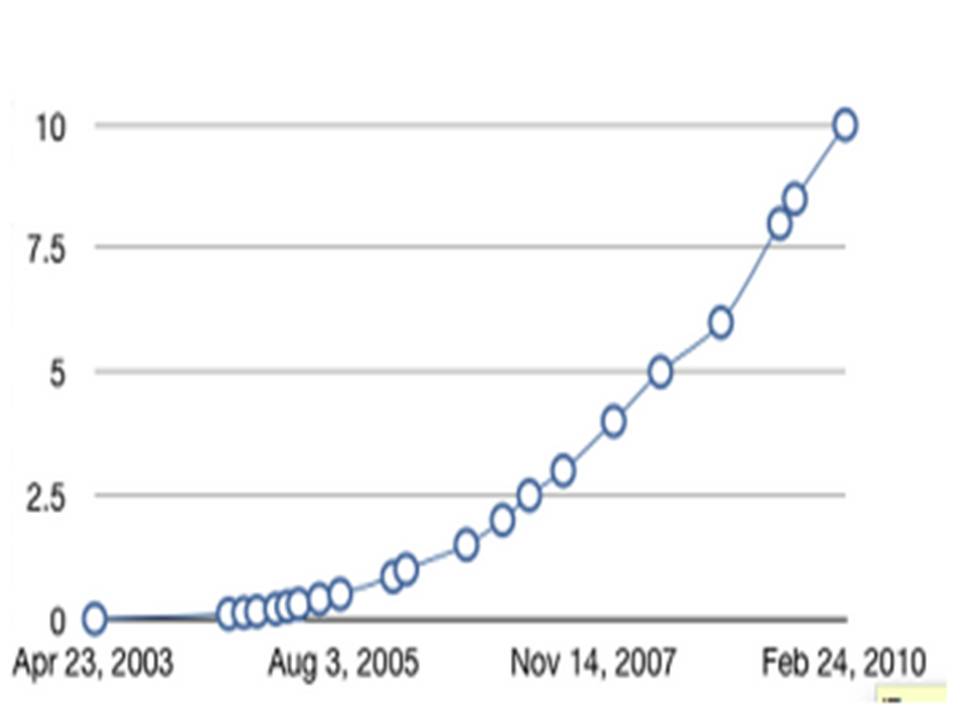
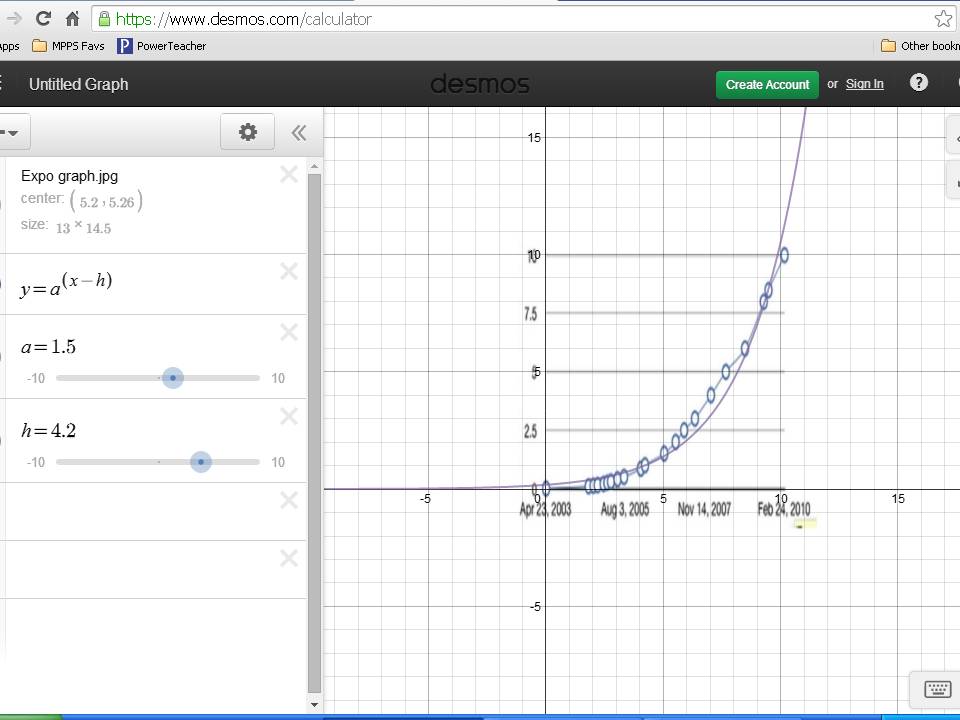
 I first put the picture on the graph then i plotted points where the picture had basketballs showing. After that i put the points into a grid then used fitpoly to get a line of best fit. After looking at the line of best fit it lead me to believe that the basketball will land in the hoop.
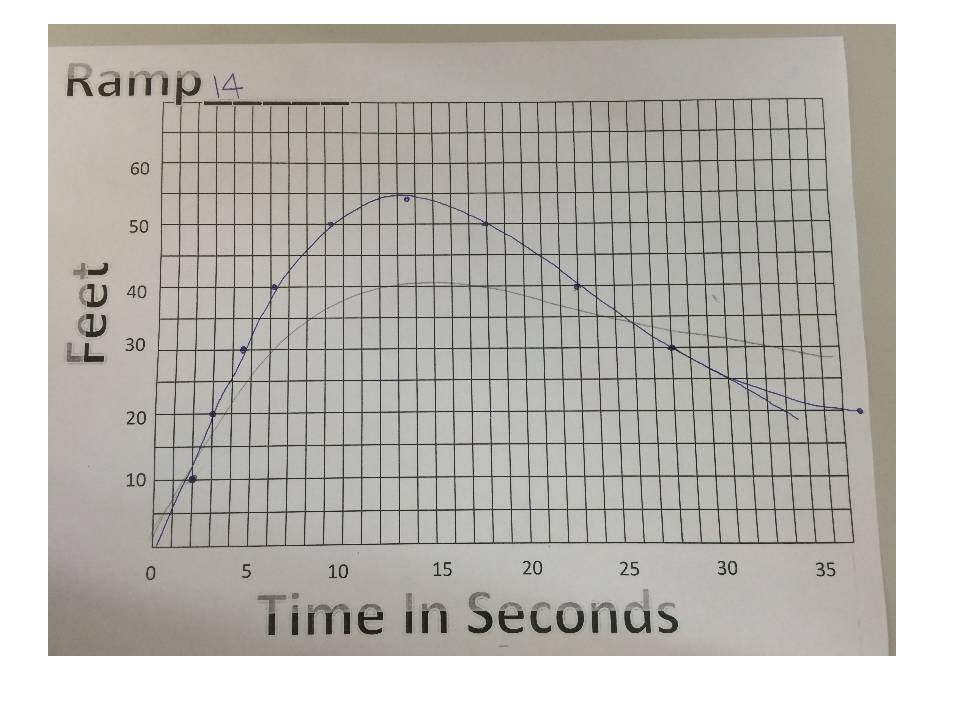
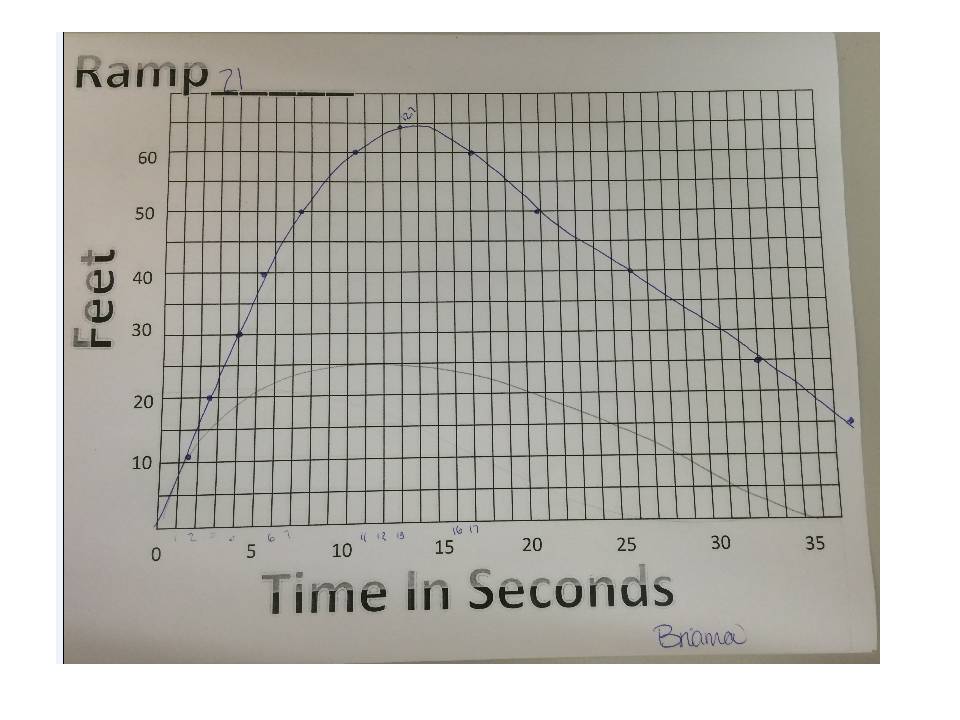
a. My very first graph on the 21 ramp was not close at all, i didn't expect the skateboard to have such a high velocity causing it to go further than i thought. I also didn't take into consideration how fast the skateboard would be moving after exiting the ramp. My second graph was more accurate however i expected the graph to have a slower decrease of speed. For the third graph i didn't expect the skateboard to stop completely, i figured it would continue on but at a very slow rate. b. The zeros on the graph represent the time before the skateboard is released. It is the time where no movement is happening and the board is at a stand still. c. All three graphs had a much higher maximum than i would have expected. The 21 in ramp had the highest maximum because the height of the ramp effected the rate at which the skateboard traveled. Next the 14, then the 7th which had the smallest maximum. The minimums of the first 2 graphs are about the same, but the third graph doesn't have a descending period. d. When the graph is rising faster it means the slope is smaller, Aka the skateboard is gaining speed at a fast rate causing the line to have a steep slope. Where as in graph 3 the height of the ramp causes the line to have a more gradual slope. 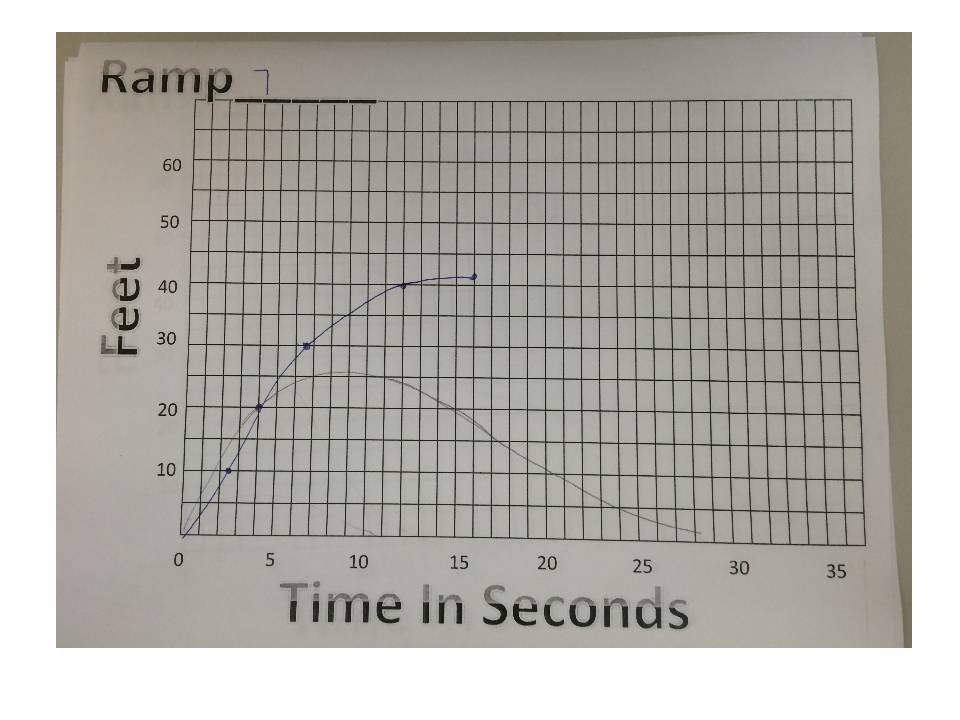
 The fist equation i used had an x^6; with an high even number as a exponent the graph is getting closer and closer to hitting zero. Thus appearing to have a flat bottom. My second equation has absolute value function, forming a V shape line. I used a negative causing the graph to flip on the x-axis and point downward. For my third equation i used cos, this cos equation is expressed by a squiggly line shown in the center of the graph.
1.
a. Same slope or rate the whole time b. The boy starts out fast but then slows down, this is why the slope decreases c. One arm is stronger than the other, causing the flag to shake and not be at a constant rate. d. The boy starts off slow but gradually speeds up e. The boy struggled during the start and end of pulling but was very speedy in the middle section f. He was feeling very very strong that day and pulled the flag up at a fast constant rate. 2. I believe that option B would be the most realistic because you might start off going at a constant rate but end up getting tired, therefore slowing down. 3. I think diagram F is the least realistic because going at that fast a speed for the period of time required it unrealistic. |
AuthorTWrite something about yourself. No need to be fancy, just an overview. Archives
March 2015
Categories |
 RSS Feed
